Appearance

Welcome, fellow developers and architects! 👋 Today, we're diving deep into a crucial aspect of modern software development: Observability in Microservices Architectures. As systems become more distributed and complex, understanding their internal state and behavior becomes a significant challenge. This is where observability comes in, offering a powerful approach to gain insights and ensure the health, performance, and reliability of your microservices.
What is Observability? 🧐
In simple terms, observability is the ability to infer the internal states of a system by examining its external outputs. Unlike traditional monitoring, which often focuses on predefined metrics and alerts, observability allows you to ask arbitrary questions about your system and understand why something is happening, not just that something is happening.
For more foundational understanding, you can refer to our catalogue entry: Understanding Observability in Modern Systems.
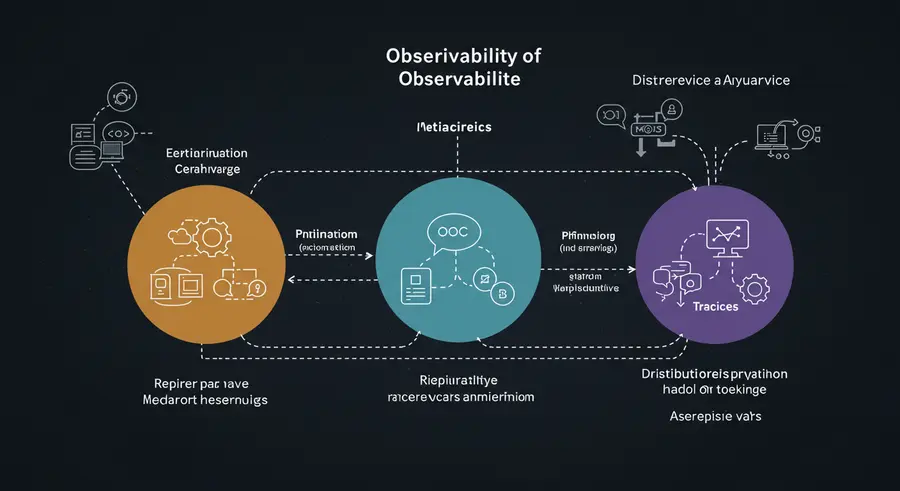
The Three Pillars of Observability: Logs, Metrics, and Traces 📊📜🔗
At the heart of any robust observability strategy lie three fundamental pillars:
Logs: 📜 Logs are immutable, timestamped records of discrete events that occur within your system. They provide granular details about what happened at a specific point in time, offering valuable context for debugging and troubleshooting.
- Best Practice: Implement centralized logging. In a microservices environment, logs are scattered across many services. Aggregating them into a single platform (e.g., Elasticsearch, Splunk, Loki) makes analysis and searching much easier. Ensure logs are structured (e.g., JSON) for easier parsing and querying.
Metrics: 📊 Metrics are numerical measurements representing the state of your system over time. They are aggregations of data points that provide a high-level overview of performance, resource utilization, and overall system health. Examples include CPU usage, memory consumption, request rates, error rates, and latency.
- Best Practice: Define clear Service Level Indicators (SLIs) and Service Level Objectives (SLOs). Monitor key performance indicators relevant to your business and user experience. Use tools like Prometheus and Grafana for collecting, storing, and visualizing metrics, creating informative dashboards.
Traces: 🔗 Traces (or distributed traces) provide an end-to-end view of a request as it propagates through multiple services in a distributed system. Each operation within a service generates a span, and a collection of interconnected spans forms a trace. This allows you to visualize the flow of a request, identify bottlenecks, and pinpoint the exact service causing an issue.
- Best Practice: Embrace distributed tracing. Tools like Jaeger, Zipkin, or OpenTelemetry enable you to instrument your code to generate traces. Correlating logs and metrics with traces is crucial for a complete understanding of system behavior.
Why is Observability Crucial for Microservices? 🚀
Microservices bring numerous benefits like independent deployment, scalability, and technological diversity. However, they also introduce significant complexity:
- Distributed Nature: Requests traverse multiple services, making it hard to follow their journey.
- Increased Dependencies: Failures in one service can cascade and impact others.
- Dynamic Environments: Services are constantly scaled up/down, deployed, and updated.
- Polyglot Stacks: Different services might use different programming languages and frameworks.
Without proper observability, diagnosing issues in such environments becomes a daunting task, leading to longer Mean Time To Resolution (MTTR) and frustrated users.
Best Practices for Implementing Observability in Microservices 💡
To maximize the benefits of observability in your microservices architecture, consider these best practices:
- Instrument Your Code: Integrate observability libraries and frameworks from the outset. Don't treat it as an afterthought.
- Standardize Telemetry Data: Ensure consistent logging formats, metric naming conventions, and trace contexts across all services. This makes correlation and analysis much easier.
- Contextualize Your Data: Enrich your logs, metrics, and traces with relevant business and technical context (e.g.,
user_id,request_id,service_version). - Automate Alerting: Set up automated alerts based on anomalies detected in your metrics and logs. Integrate these alerts with your incident management system.
- Build Comprehensive Dashboards: Create dashboards that provide a holistic view of your system's health, focusing on key performance indicators and service dependencies.
- Practice Observability as Code: Define your observability configurations (e.g., alert rules, dashboard definitions) as code, version control them, and automate their deployment.
- Foster an Observability Culture: Educate your development and operations teams on the importance of observability and empower them with the tools and knowledge to utilize it effectively.
- Monitor Service Dependencies: Understand the relationships between your services and monitor their communication patterns to identify potential points of failure.
Conclusion 🎉
Observability is not just a buzzword; it's a fundamental shift in how we approach understanding and managing complex distributed systems. By embracing the three pillars – logs, metrics, and traces – and implementing best practices, you can unlock unparalleled insights into your microservices, leading to faster issue resolution, improved system reliability, and ultimately, a better experience for your users.
Start your observability journey today, and gain the clarity you need to navigate the complexities of modern microservices!